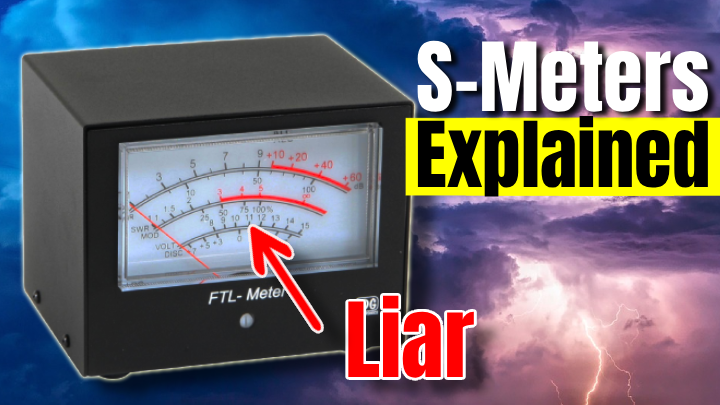
TL;DR — Your S meter is a storyteller, not a lab instrument
- Core idea: S meters are only loosely calibrated and work best as relative indicators, not precision instruments.
- Why it matters: Misreading the meter leads to bad signal reports, wrong antenna decisions, and confusion about band conditions.
- Key benefit: Once you understand what the meter really measures, you can give better reports and do better station testing.
- Who it's for: HF operators, contesters, new hams, and anyone comparing antennas, rigs, or preamps using S meter readings.
If you take your S meter at face value, you're probably getting misled several times a minute. Most modern HF rigs have meters that wander all over the place, ignore the old 6 dB per S unit rule, and react more to AGC and noise than to actual signal strength. The good news is you don't need a perfect meter to operate well. You just need to understand what the thing is really telling you.
On paper, S units look simple enough. By convention, S9 on HF equals 50 microvolts into 50 ohms, and each S unit is supposed to represent a 6 dB change. Double the voltage and you gain one S unit. In the real world, that nice clean idea turns messy fast as soon as you touch RF gain, switch a preamp, change filters, or hop bands.
Manufacturers know most of us care more about whether a signal is weak, fair, or loud than its exact voltage at the antenna jack. So the S meter is usually tuned to look reasonable instead of being lab accurate. That’s fine right up until you start treating those numbers like gospel when you’re giving reports, chasing noise problems, or comparing antennas.
What your S meter is actually measuring
The S meter is not measuring the other station in some pure RF sense. It’s sampling signal at a point inside the receiver chain, and that point is heavily influenced by AGC, roofing filters, IF gain, and DSP. Depending on the rig, it might be looking at RF, IF, audio, or even post-DSP levels.
When band noise is high, the AGC is constantly riding the gain and small signal changes barely move the needle. When the band is quiet and you kick in a preamp, suddenly every little blip looks huge. Same station, same power. Totally different reading, just because the receiver is sitting in a different part of its gain curve.
Textbook S meter specs vs real-world behavior
| Metric |
Value |
Why It Matters |
| Legacy S9 reference (HF) |
50 µV into 50 Ω |
Gives a common voltage reference so two receivers can agree what "S9" means in the lab. |
| Ideal S-unit spacing |
6 dB per S unit |
Each S step should represent a meaningful change in signal strength, but many rigs deviate by several dB. |
A quick sanity check for your S meter
You don’t need a full RF lab to get a reality check on your meter. A simple attenuator, a stable local signal, or even a signal generator in another rig is enough to see how your S units behave on at least one band and mode.
Start by finding or creating a steady signal that reads somewhere around S5 to S7. That could be a nearby transmitter into a dummy load with a bit of leakage, or a low-power signal from a local antenna. Next, add known attenuation in 3 or 6 dB steps and watch how many S units the meter actually moves. Then repeat the whole thing with and without the preamp, and on another band, just to see how wildly the spacing changes depending on setup.
Why one S unit is not always 6 dB
On a lot of radios, S units are closest to 6 dB right around S9, then get compressed above that and stretched below it. At the low end, AGC thresholds, noise blankers, and DSP noise reduction shove the meter around. At the high end, the IF chain is already nearing its comfort zone, so another big jump in signal barely nudges the display.
So when you tell someone they’re S5 instead of S7, that doesn’t automatically mean they’re 12 dB weaker. On your rig, in that moment, it might only be 6 or 7 dB. Or the meter might barely move at all because the extra signal is buried in noise and the AGC is clamped down hard.
Reading S meters like a ham, not a lab tech
Once you stop expecting the S meter to behave like a precision voltmeter, it suddenly becomes far more useful. Think of it as a relative indicator that works alongside your ears. When the meter jumps but readability doesn’t improve, you’re probably watching noise or AGC action. When a signal only climbs one S unit but goes from barely readable to armchair copy, that tells you a lot about noise floor and QSB.
You’ll also notice that different radios, and even the same radio on different bands, report wildly different numbers for the same on-air signal. That’s why comparing “S7 on my rig versus S7 on yours” is mostly meaningless unless both receivers have been calibrated against a known source. For everyday operating, focus on readability and relative changes on your own station.
Frequently Asked Questions
Should I ever trust my S meter numbers?
Yes, but only within a tight bubble. If you keep the same rig, same band, same filters, and the same RF gain, then changes on the meter are useful for comparing antennas, feedlines, or power levels. What doesn't work is treating "S7" like a universal truth that means the same thing in every shack.
Why does my S meter move when no one is transmitting?
That's your noise floor and AGC doing their thing. Atmospheric noise, man-made junk, band openings, and even your own power supplies all look like signal to the receiver. When that noise shifts by a few dB, the AGC responds and the meter follows along, even with no stations on frequency.
What about panadapters and SDR waterfalls?
Panadapters are great for showing relative signal levels across a band, but they're still affected by gain stages, AGC, and reference settings. Treat the dB scale on a waterfall the same way you treat an S meter. It's excellent for comparison, but questionable for absolute precision unless you've calibrated it yourself.
How to use S meter readings when testing gear
The place where S meters really earn their keep is A/B testing. When you’re trying a new antenna, swapping feedline, or playing with preamps, the meter gives you a fast and repeatable way to see which setup helps more on average. The trick is controlling everything else so you’re actually testing the gear, not the AGC.
Pick a band and a time when there’s a steady flow of stations. Stick to one mode and one bandwidth. Lock RF gain, preamp, and attenuator settings in place. Then switch between antennas or configurations and log both the average S reading and how readable each station sounds. After enough samples, the patterns are far more trustworthy than any single report.
Why S meters and RST reports rarely agree
RST reports blend subjective readability, audio quality, and a loose guess at loudness. The S meter is only trying to describe that last part, and it does a rough job of it. A signal can look strong on the meter while being distorted, fluttery, or smeared by multipath, which absolutely deserves a lower R value.
This is why “you’re 5 by 9” gets tossed around even on weak, noisy signals. It’s habit, and in contests it’s just macro filler. If you actually want to help another ham, describe what you’re hearing and let the S meter play a supporting role instead of being the headline.
Practical tips for living with a lying S meter
Instead of fighting the meter, treat it like a quirky but useful friend. With a little discipline and repeatable habits, it becomes a solid station-building tool without pretending to be calibrated lab gear.
Use the same rig and the same settings when doing comparisons so changes on the meter reflect real RF differences as much as possible. Log both readability and S meter readings when testing antennas or new gear, then look for trends across many contacts instead of obsessing over one number. And pair what you see on the meter with other tools like reverse beacons, digital reports, or SDR waterfalls to confirm whether a change actually helped.
If you’re early in your ham journey and still sorting out what really matters, check the Getting Started section for a bigger-picture view of building a first station. When you’re ready to dig deeper into antennas and propagation, the Antennas and SDR sections are worth a long read too.
So what should you believe: the meter or your ears?
Your S meter isn’t useless. It just isn’t the precision instrument the scale suggests. Once you treat it as a relative gauge of louder or quieter instead of an absolute truth machine, it becomes a powerful tool for antenna work, troubleshooting, and on-air reporting.
Use S meter readings for controlled comparisons on one rig with one set of settings. Base signal reports on readability and audio quality, with the meter as backup information. And when you’re making station changes, combine what the meter shows with other data sources before you declare victory.
If you want your signal reports and station experiments to actually mean something, trust your ears first and let the meter fill in the gaps. Then go spin the dial and see what your own rig is really telling you.